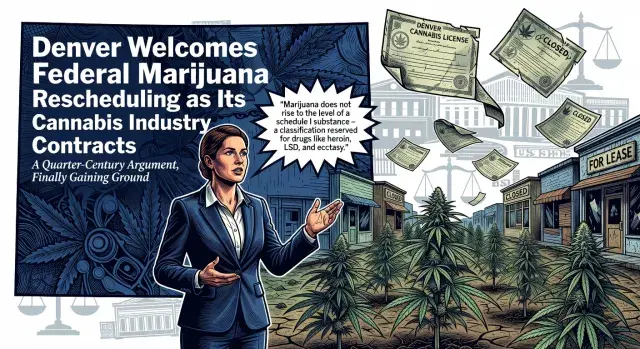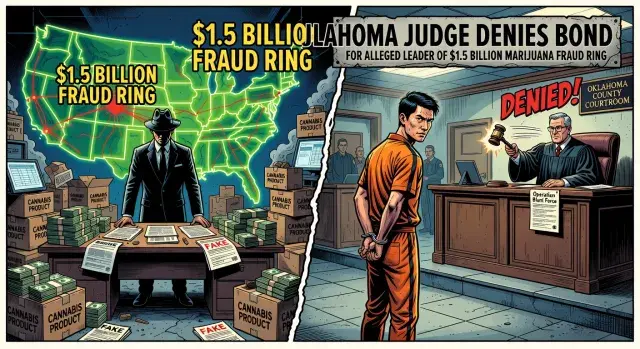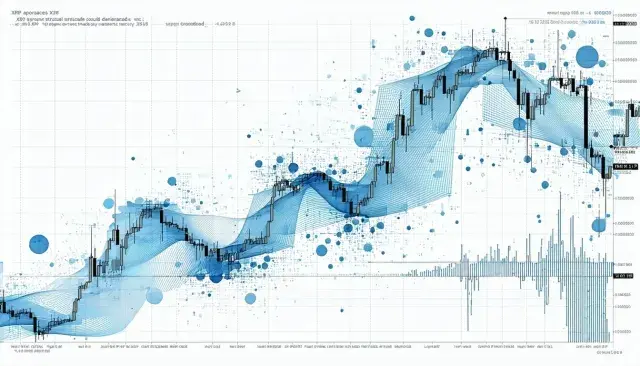
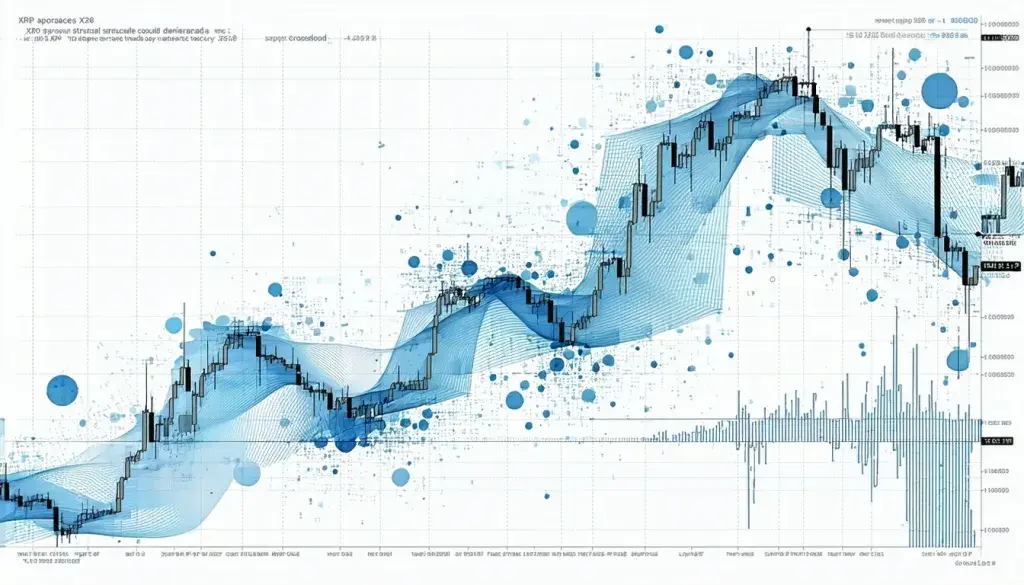
After spending months trading below the $2 threshold - a level it hasn't touched since late January 2026 - Ripple's XRP token is sitting at what technical analysts are calling a convergence of three mutually reinforcing support factors, all visible on the two-week chart. At $1.40 with modest daily gains, XRP is neither crashing nor surging. It's consolidating. And in cryptocurrency markets, that kind of quiet often precedes something louder.
Three Signals Stacking at the Same Price Zone
According to a macro technical analysis published by U.K.-based price analyst ChartNerd, XRP is forming what he describes as a "critical convergence point" - a phrase that, stripped of the hype, refers to something fairly specific: three independent technical indicators arriving at the same support range simultaneously.
The first is a long-standing support level that has held for roughly six years; a floor the market has repeatedly recognized and defended. The second is a resistance trendline, previously untested since the 2024 bull run, now potentially flipping into support as price action works beneath it. The third is the lower band of the Gaussian channel - a volatility-smoothing indicator that traders use to identify whether an asset is sitting in a statistically normal range or signaling an overextension.
Together, these form a falling wedge structure - a pattern that, in classic technical analysis, tends to resolve to the upside, though with no guarantees. The thing is, technical setups don't operate in isolation. Volume has to confirm the move. Without it, a wedge breakout is just noise.
The Bullish Case Requires Some External Cooperation
ChartNerd's bullish scenario targets a move toward the $1.80-$2.00 range, contingent on two conditions: positive trading volume confirming the ascending support, and macroeconomic signals that don't actively undercut sentiment. That second condition is the harder one to model.
The broader financial environment remains unsettled. Following the outbreak of conflict in Iran and the disruption of regular operations through the Strait of Hormuz - one of the world's most consequential oil transit chokepoints - risk assets broadly have absorbed uncertainty at irregular intervals. Cryptocurrency markets, which have no fundamental earnings anchor, are particularly susceptible to sudden sentiment shifts when geopolitical stress spills into traditional markets. Whether that uncertainty gets "priced in" cleanly, or arrives in disruptive waves, matters considerably for any short-term technical thesis.
XRP does carry one distinct factor that sets it apart from purely speculative altcoins: Ripple's ongoing legal and institutional history gives the token a baseline of narrative gravity. The $50 million SEC settlement last year, and the subsequent run to a then-all-time high of $3.65, demonstrated that regulatory clarity - even partial clarity - can function as a genuine price catalyst, not just a sentiment boost.
The Bear Case Is Blunt and Historical
ChartNerd's downside scenario doesn't soften the numbers. If the lower Gaussian channel band near $0.96 fails to hold, prior bear cycles suggest the token could shed 60-70% of its value before finding a durable floor. XRP has been here before - multiple times. Each of those drawdowns eventually reversed into triple-digit percentage recoveries, including the 169% run that produced last year's $3.65 high. Patient holders have historically been rewarded. That said, "historically" is doing a lot of work in a market that remains structurally young and susceptible to liquidity shocks that don't follow prior patterns cleanly.
What separates a 60% drawdown from a temporary correction, in practice, is whether the six-year support level holds. That's the line ChartNerd has drawn. Below $0.96 with volume, and the technical thesis shifts - potentially for months.
What the Setup Actually Tells Us
Convergence setups like this one are useful not because they predict outcomes with certainty, but because they clarify the decision architecture. The relevant question isn't whether XRP will break up or break down - it's whether the support zone holds under conditions of increasing pressure. Right now, three layers of technical structure suggest it has a reasonable foundation to do so. Geopolitical volatility and broader market direction remain the variables that no chart can fully absorb.
For holders and observers alike, the honest read is this: XRP is at a juncture where the technical setup is arguably as constructive as it has been in months, and the risk of a significant decline is real and quantifiable. That's a rare degree of structural clarity in a market that rarely offers it.